Basic Statistics
Element | 1961 | 1962 | 1963 | 1964 | 1965 | 1966 | 1967 | 1968 | 1969 | 1970 | 1971 | 1972 | 1973 | 1974 | 1975 | 1976 | 1977 | 1978 | 1979 | 1980 | 1981 | 1982 | 1983 | 1984 | 1985 | 1986 | 1987 | 1988 | 1989 | 1990 | 1991 | 1992 | 1993 | 1994 | 1995 | 1996 | 1997 | 1998 | 1999 | 2000 | 2001 | 2002 | 2003 | 2004 | 2005 | 2006 | 2007 | 2008 | 2009 | 2010 | 2011 | 2012 | 2013 | 2014 |
|---|---|---|---|---|---|---|---|---|---|---|---|---|---|---|---|---|---|---|---|---|---|---|---|---|---|---|---|---|---|---|---|---|---|---|---|---|---|---|---|---|---|---|---|---|---|---|---|---|---|---|---|---|---|---|
Arable land (000 Ha) | 2,897.00 | 2,897.00 | 2,897.00 | 2,897.00 | 2,897.00 | 2,897.00 | 2,897.00 | 2,897.00 | 2,897.00 | 2,897.00 | 2,897.00 | 2,897.00 | 2,907.00 | 2,917.00 | 2,997.00 | 3,095.00 | 3,095.00 | 3,143.00 | 3,140.00 | 3,137.00 | 3,135.00 | 3,132.00 | 3,130.00 | 3,127.00 | 3,130.00 | 3,180.00 | 3,180.00 | 3,203.00 | 3,223.00 | 3,273.00 | 3,322.00 | 3,342.00 | 3,370.00 | 3,390.00 | 3,420.00 | 3,400.00 | 3,600.00 | 3,600.00 | 3,600.00 | 3,600.00 | 3,900.00 | 3,700.00 | 3,800.00 | 3,800.00 | 4,500.00 | 4,450.00 | 4,300.00 | 4,300.00 | 4,300.00 | 4,500.00 | 4,900.00 | 4,900.00 | 4,900.00 | |
Rice area (000 Ha) | 22.00 | 23.35 | 26.50 | 27.00 | 27.39 | 28.34 | 24.70 | 30.98 | 36.39 | 41.00 | 54.73 | 50.05 | 55.00 | 43.20 | 40.68 | 46.98 | 16.80 | 50.00 | 50.00 | 40.00 | 40.00 | 41.34 | 38.26 | 32.04 | 14.80 | 18.41 | 21.35 | 31.62 | 38.00 | 36.85 | 48.47 | 53.40 | 41.36 | 52.00 | 59.63 | 62.30 | 87.02 | 80.32 | 90.86 | 89.57 | 87.17 | 103.80 | 95.00 | 93.85 | 109.82 | 80.84 | 80.00 | 110.85 | 107.81 | 130.00 | 130.00 | 200.00 | 205.00 | 150.00 |
Paddy yield (t/Ha) | 1.05 | 1.01 | 1.28 | 1.41 | 0.91 | 1.30 | 1.31 | 1.13 | 1.01 | 0.96 | 0.94 | 0.80 | 0.76 | 0.85 | 0.96 | 1.06 | 1.19 | 0.41 | 0.51 | 1.17 | 1.10 | 0.56 | 0.47 | 0.39 | 0.53 | 0.81 | 0.91 | 2.34 | 2.79 | 1.79 | 2.43 | 2.03 | 0.56 | 1.74 | 1.32 | 1.57 | 1.29 | 1.50 | 1.52 | 1.03 | 1.29 | 1.30 | 1.33 | 0.97 | 1.35 | 1.32 | 1.33 | 1.53 | 1.62 | 1.31 | 1.33 | 1.40 | 1.61 | 1.42 |
Paddy Production (000 t) | 23.00 | 23.50 | 34.00 | 38.00 | 25.00 | 36.96 | 32.30 | 35.00 | 36.65 | 39.45 | 51.18 | 40.00 | 42.00 | 36.63 | 38.95 | 50.00 | 20.00 | 20.70 | 25.70 | 46.80 | 43.80 | 23.30 | 18.03 | 12.37 | 7.82 | 14.88 | 19.50 | 73.86 | 105.97 | 66.03 | 117.72 | 108.21 | 23.10 | 90.55 | 78.98 | 97.73 | 112.29 | 120.67 | 138.28 | 92.62 | 112.17 | 134.88 | 126.02 | 91.08 | 148.70 | 106.57 | 106.38 | 169.76 | 175.00 | 170.00 | 172.57 | 280.00 | 330.00 | 213.00 |
Milled production (000 t) | 15.34 | 15.68 | 22.68 | 25.35 | 16.68 | 24.65 | 21.55 | 23.34 | 24.45 | 26.32 | 34.14 | 26.68 | 28.01 | 24.43 | 25.98 | 33.35 | 13.34 | 13.81 | 17.14 | 31.22 | 29.22 | 15.54 | 12.02 | 8.25 | 5.22 | 9.93 | 13.00 | 49.27 | 70.68 | 44.04 | 78.52 | 72.18 | 15.41 | 60.40 | 52.68 | 65.18 | 74.90 | 80.48 | 92.23 | 61.78 | 74.82 | 89.96 | 84.06 | 60.75 | 99.18 | 71.08 | 70.96 | 113.23 | 116.72 | 113.39 | 115.10 | 186.76 | 220.11 | |
Rice imports (000 t) | 0.80 | 0.07 | 0.17 | 0.10 | 0.02 | 0.02 | 0.02 | 0.03 | 0.07 | 0.02 | 0.05 | 0.01 | 0.02 | 0.77 | 0.51 | 1.00 | 2.00 | 3.00 | 5.50 | 2.45 | 2.10 | 5.00 | 3.05 | 8.51 | 27.38 | 17.20 | 17.00 | 17.00 | 9.50 | 5.00 | 5.00 | 5.00 | 37.50 | 6.70 | 5.87 | 1.90 | 2.30 | 1.56 | 0.02 | 0.30 | 5.03 | 5.22 | 1.65 | 0.53 | 0.75 | 0.76 | 10.94 | 1.01 | 7.85 | 1.02 | ||||
Rice exports (000 t) | 0.08 | 0.04 | 0.13 | 0.06 | 0.04 | 0.01 | 0.01 | |||||||||||||||||||||||||||||||||||||||||||||||
Total rice consumption (000 t) | 16.14 | 15.74 | 22.85 | 20.46 | 21.67 | 24.66 | 21.57 | 23.37 | 24.52 | 26.26 | 30.82 | 29.89 | 27.98 | 25.15 | 26.48 | 26.38 | 23.30 | 16.79 | 22.62 | 33.66 | 31.30 | 20.52 | 15.06 | 16.72 | 32.48 | 27.05 | 29.93 | 56.24 | 70.19 | 68.93 | 63.59 | 67.20 | 67.67 | 72.04 | 68.48 | 67.07 | 77.19 | 80.48 | 72.32 | 81.69 | 76.36 | 89.98 | 74.40 | 75.72 | 84.46 | 72.73 | 83.43 | 113.98 | 117.48 | 119.30 | 121.09 | 143.23 | 158.63 | |
Fertilizer usage (NPK) (000 t) | 0.06 | 0.05 | 0.06 | 0.03 | 0.16 | 0.17 | 0.39 | 0.48 | 0.61 | 0.66 | 0.77 | 0.85 | 1.64 | 3.05 | 1.97 | 2.62 | 2.44 | 2.23 | 0.00 | 0.29 | 1.47 | 1.72 | 1.85 | 2.24 | 2.27 | 1.32 | 1.70 | 1.52 | 1.52 | 1.77 | 2.59 | 3.02 | 1.56 | 2.06 | 2.50 | 3.50 | 2.18 | 4.67 | 4.86 | 4.86 | 4.49 |
Production |
Imports and exports |
Caloric intake (%/day) from rice relative to other sources |
Protein intake (%/day) from rice relative to other sources |
General information
|
Production seasons
|
Write-up taken from the IRRI's Rice Almanac (2013):
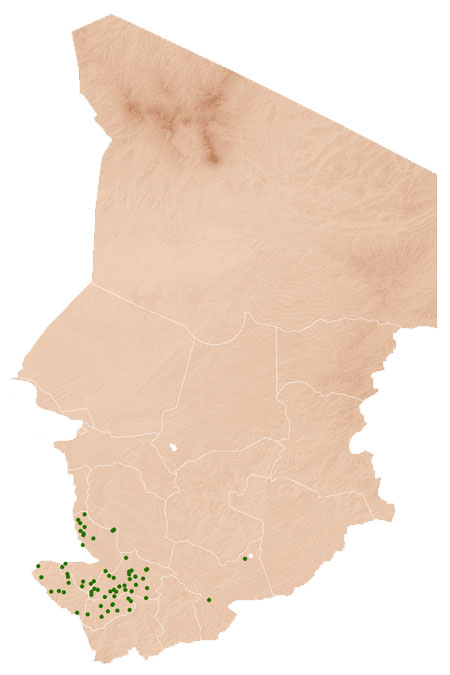
The Republic of Chad is a landlocked country of 1,259,200 km2 in the Sahel region of Africa. The country is divided into three regions: desert (the Sahara) in the north, occupying 40% of the total area; plains in the central part, used mainly for grazing; and fertile lands in the south that are more tropical and on which most of the 11.5 million population lives. Agriculture is a dominant force in the economy at 51% of GDP, with 66% (in 2010) of the population engaged in agricultural activities. Arable land, however, is only 3.4% of its land area.
Source: FAOSTAT database online and AQUASTAT database online, as of November 2012.