Basic Statistics
Element | 1961 | 1962 | 1963 | 1964 | 1965 | 1966 | 1967 | 1968 | 1969 | 1970 | 1971 | 1972 | 1973 | 1974 | 1975 | 1976 | 1977 | 1978 | 1979 | 1980 | 1981 | 1982 | 1983 | 1984 | 1985 | 1986 | 1987 | 1988 | 1989 | 1990 | 1991 | 1992 | 1993 | 1994 | 1995 | 1996 | 1997 | 1998 | 1999 | 2000 | 2001 | 2002 | 2003 | 2004 | 2005 | 2006 | 2007 | 2008 | 2009 | 2010 | 2011 | 2012 | 2013 | 2014 |
|---|---|---|---|---|---|---|---|---|---|---|---|---|---|---|---|---|---|---|---|---|---|---|---|---|---|---|---|---|---|---|---|---|---|---|---|---|---|---|---|---|---|---|---|---|---|---|---|---|---|---|---|---|---|---|
Arable land (000 Ha) | 595.00 | 577.00 | 792.00 | 790.00 | 793.00 | 792.00 | 792.00 | 798.00 | 804.00 | 810.00 | 816.00 | 822.00 | 828.00 | 834.00 | 850.00 | 900.00 | 950.00 | 1,000.00 | 900.00 | 900.00 | 900.00 | 857.00 | 869.00 | 872.00 | 876.00 | 887.00 | 895.00 | 898.00 | 901.00 | 900.00 | 903.00 | 905.00 | 880.00 | 883.00 | 886.00 | 887.00 | 888.00 | 889.00 | 905.00 | 915.00 | 916.00 | 936.00 | 950.00 | 900.00 | 1,100.00 | 1,050.00 | 1,000.00 | 1,200.00 | 1,100.00 | 1,200.00 | 1,300.00 | 1,250.00 | 1,300.00 | |
Rice area (000 Ha) | 495.55 | 526.73 | 535.08 | 538.06 | 431.82 | 534.03 | 544.79 | 567.24 | 536.35 | 718.68 | 693.77 | 638.97 | 671.69 | 797.02 | 597.23 | 635.47 | 782.28 | 839.42 | 789.56 | 823.73 | 842.47 | 746.00 | 776.66 | 885.81 | 864.68 | 836.40 | 679.42 | 815.56 | 689.75 | 828.25 | 790.66 | 766.02 | 819.77 | 896.55 | 889.59 | 660.08 | 690.08 | 767.00 | 870.80 | 832.00 | 765.04 | 819.59 | 911.44 | 719.69 | 915.26 | 910.49 | 816.71 | 1,052.99 | 942.41 | 1,060.36 | 1,091.05 | 1,066.62 | 1,188.00 | 881.00 |
Paddy yield (t/Ha) | 1.86 | 1.95 | 1.95 | 2.00 | 1.77 | 1.84 | 2.13 | 2.40 | 2.57 | 2.25 | 2.01 | 2.05 | 1.95 | 2.01 | 1.93 | 1.97 | 2.14 | 2.25 | 2.43 | 2.59 | 2.65 | 2.89 | 3.20 | 2.73 | 3.08 | 3.09 | 3.13 | 3.04 | 2.99 | 3.06 | 3.02 | 3.05 | 3.14 | 2.99 | 3.16 | 3.12 | 3.25 | 3.51 | 3.28 | 3.44 | 3.52 | 3.49 | 3.37 | 3.65 | 3.55 | 3.67 | 3.83 | 3.68 | 3.87 | 4.06 | 3.57 | 3.61 | 3.89 | 3.84 |
Paddy Production (000 t) | 923.02 | 1,029.19 | 1,045.91 | 1,074.05 | 764.16 | 980.75 | 1,158.15 | 1,359.54 | 1,375.96 | 1,615.93 | 1,395.78 | 1,312.45 | 1,312.42 | 1,602.31 | 1,154.16 | 1,252.62 | 1,677.29 | 1,890.49 | 1,917.22 | 2,133.20 | 2,229.35 | 2,155.63 | 2,483.53 | 2,419.70 | 2,661.21 | 2,588.18 | 2,127.83 | 2,476.61 | 2,063.44 | 2,538.00 | 2,389.00 | 2,339.70 | 2,570.00 | 2,683.69 | 2,809.89 | 2,061.52 | 2,239.37 | 2,692.34 | 2,857.10 | 2,859.90 | 2,695.08 | 2,859.48 | 3,071.20 | 2,628.00 | 3,246.00 | 3,342.00 | 3,131.00 | 3,875.00 | 3,651.67 | 4,300.62 | 3,894.89 | 3,845.94 | 4,621.00 | 3,381.00 |
Milled production (000 t) | 615.66 | 686.47 | 697.62 | 716.39 | 509.69 | 654.16 | 772.49 | 906.82 | 917.76 | 1,077.83 | 930.98 | 875.40 | 875.38 | 1,068.74 | 769.82 | 835.50 | 1,118.76 | 1,260.96 | 1,278.79 | 1,422.84 | 1,486.97 | 1,437.80 | 1,656.51 | 1,613.94 | 1,775.03 | 1,726.31 | 1,419.26 | 1,651.90 | 1,376.31 | 1,692.85 | 1,593.46 | 1,560.58 | 1,714.19 | 1,790.02 | 1,874.20 | 1,375.03 | 1,493.66 | 1,795.79 | 1,905.69 | 1,907.55 | 1,797.62 | 1,907.27 | 2,048.49 | 1,752.88 | 2,165.08 | 2,229.11 | 2,088.38 | 2,584.62 | 2,435.66 | 2,868.51 | 2,597.89 | 2,565.25 | 3,082.03 | |
Rice imports (000 t) | 469.02 | 410.66 | 402.95 | 658.00 | 642.00 | 487.60 | 375.80 | 338.00 | 264.20 | 544.60 | 339.20 | 266.40 | 343.50 | 297.41 | 465.35 | 377.90 | 538.75 | 186.84 | 211.64 | 168.32 | 154.58 | 111.65 | 176.81 | 20.34 | 160.62 | 189.85 | 71.80 | 176.01 | 299.89 | 130.27 | 132.95 | 236.91 | 181.41 | 31.63 | 9.11 | 289.28 | 305.44 | 166.68 | 206.03 | 14.85 | 51.92 | 94.93 | 34.52 | 240.40 | 51.73 | 17.09 | 129.72 | 99.20 | 73.13 | 150.38 | 37.49 | 45.91 | 24.06 | |
Rice exports (000 t) | 8.70 | 0.02 | 0.02 | 0.03 | 0.01 | 0.50 | 0.00 | 0.09 | 0.09 | 0.13 | 0.24 | 0.24 | 0.44 | 0.45 | 0.48 | 31.16 | 43.80 | 1.16 | 1.39 | 2.70 | 1.36 | 1.98 | 1.74 | 2.07 | 2.05 | 2.33 | 3.97 | 2.61 | 5.51 | 3.79 | 4.45 | 10.50 | 5.87 | 30.13 | 10.24 | |||||||||||||||||||
Total rice consumption (000 t) | 1,025.69 | 1,079.47 | 1,142.89 | 1,077.36 | 1,253.20 | 1,312.92 | 1,047.92 | 1,191.27 | 1,176.91 | 1,194.16 | 1,312.74 | 1,307.38 | 1,324.14 | 1,444.82 | 1,368.51 | 1,569.10 | 1,438.28 | 1,379.78 | 1,388.27 | 1,484.94 | 1,638.57 | 1,650.31 | 1,706.35 | 1,633.40 | 1,878.70 | 1,815.74 | 1,766.73 | 1,825.62 | 1,671.12 | 1,820.37 | 1,723.16 | 1,768.53 | 1,659.20 | 1,864.25 | 1,786.84 | 1,787.44 | 1,821.56 | 1,876.88 | 1,990.28 | 1,913.12 | 1,944.97 | 1,944.66 | 1,972.58 | 2,092.15 | 2,212.27 | 2,243.24 | 2,289.70 | 2,370.71 | 2,452.69 | 2,565.68 | 2,533.07 | 2,531.30 | 2,613.23 | |
Fertilizer usage (NPK) (000 t) | 140.49 | 165.46 | 114.63 | 106.97 | 121.59 | 131.86 | 128.43 | 163.26 | 110.70 | 129.75 | 137.62 | 121.53 | 134.18 | 122.18 | 85.18 | 105.89 | 117.47 | 135.89 | 162.12 | 183.62 | 163.78 | 181.60 | 193.00 | 218.92 | 222.24 | 217.77 | 227.61 | 230.62 | 233.91 | 190.16 | 196.22 | 202.94 | 239.20 | 246.32 | 232.55 | 238.07 | 235.03 | 262.00 | 286.28 | 269.90 | 266.45 | 304.56 | 259.18 | 287.01 | 255.29 | 291.31 | 288.52 | 311.71 | 281.37 | 230.75 | 257.32 | 198.37 | 160.04 |
Production |
Imports and exports |
Caloric intake (%/day) from rice relative to other sources |
Protein intake (%/day) from rice relative to other sources |
General information
|
Production seasons
|
Write-up taken from the IRRI's Rice Almanac (2013):
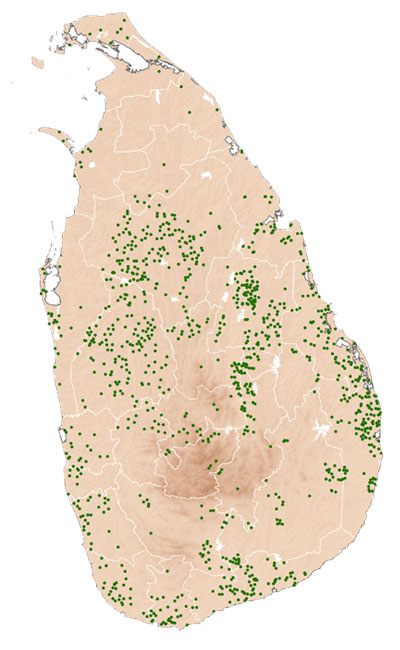
Sri Lanka, a small island at the southern tip of India, had a population of 21 million in 2011. The country has an area of 65,610 km2, which is divided into two climate zones, wet in the southwest and dry elsewhere. The land is mainly flat with a central mountain range. Arable land was 19% of the total land area in 2009. Agriculture accounts for 44% of the workforce and 12% of GDP. Rice is the second largest crop after tea.
Source: FAOSTAT database online and AQUASTAT database online, as of November 2012.